
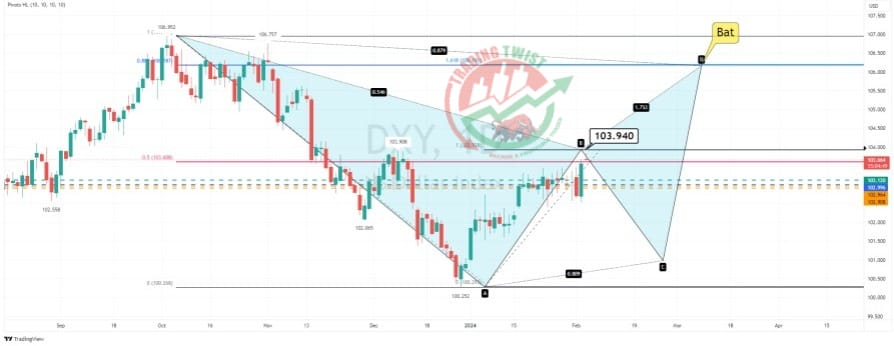
DXY (USD Index)Chart Technical Outlook – strong employment data from the United States resulted in a reversal in intraday sentiment and DXY trading to the highest level in 37 days. Although there is no clear indication of an immediate change of trend, we have a solid upside barrier between 103.94 and 104.00
- 103.94 is the projected AB leg of a large daily Bat formation.
- 104.00 is an AB=CD corrective formation.
Correlation studies would suggest a limited downside for Gold.


Hey, cool post There is an issue with your website in Internet Explorer; could you please check this? Because of this issue, many people will overlook your excellent article because IE is still the most used browser.