
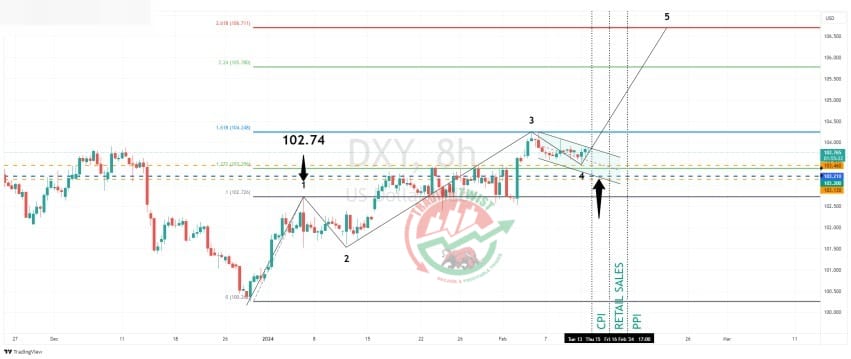
DXY Chart Technical Outlook(USD Index) – we have seen mixed and volatile intraday trading for four days. This has resulted in a corrective channel formation on the 8-hour chart. This can be analyzed as a fourth-wave correction in a bullish Elliott Wave counts (5 waves). The medium-term bias remains bullish but there is ample scope for dips lower inside this formation. Only a breach of the 102.74 swing high would negate the bullish bias.


