
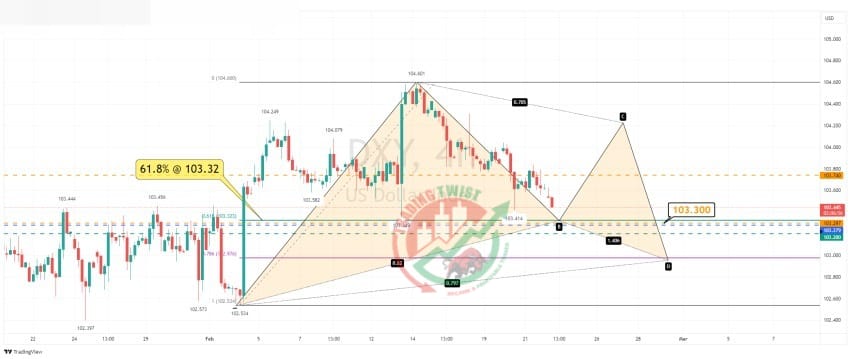
DXY Chart Technical Outlook – we have continued to the downside since posting a medium-term swing high of 104.60 on February 14. The 61.8% pullback level is located at 103.23. Bespoke support is located at 103.30. Although this support zone could stall the sell-off, the rally could be limited within the BC leg of a Gartley formation. The immediate bias is to buy into dips.


