
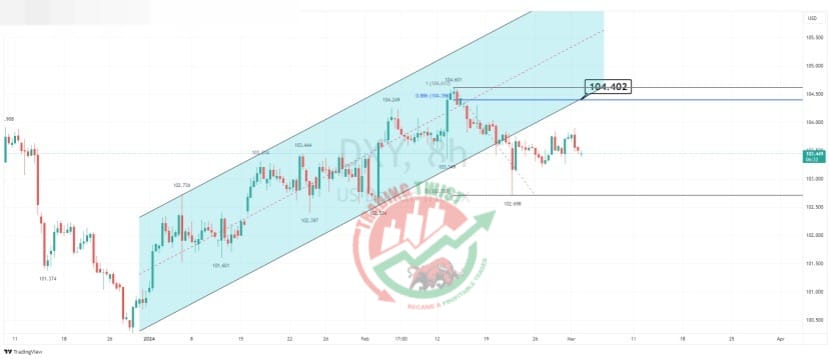
DXY Chart Technical Outlook we continue to see mixed intraday price action. The 8-hour chart highlights the breakout of a channel formation. The reverse trendline resistance is located at 104.40. I look for rallies to be sold (bearish).
DXY Chart Technical Outlook we continue to see mixed intraday price action. The 8-hour chart highlights the breakout of a channel formation. The reverse trendline resistance is located at 104.40. I look for rallies to be sold (bearish).


