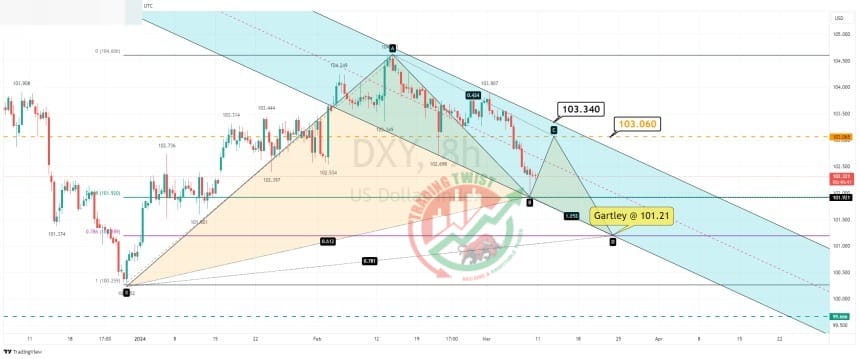
DXY Chart Technical Outlook the initial sell-off after the non-farm payroll data was short-lived with buyers emerging close to the 61.8% Fibonacci level of 101.92. We are holding within a bearish channel formation. Bespoke resistance is located at 103.06. Trendline resistance is located at 103.34. We will form a bullish Gartley pattern at 101.19. I look for rallies to be sold.