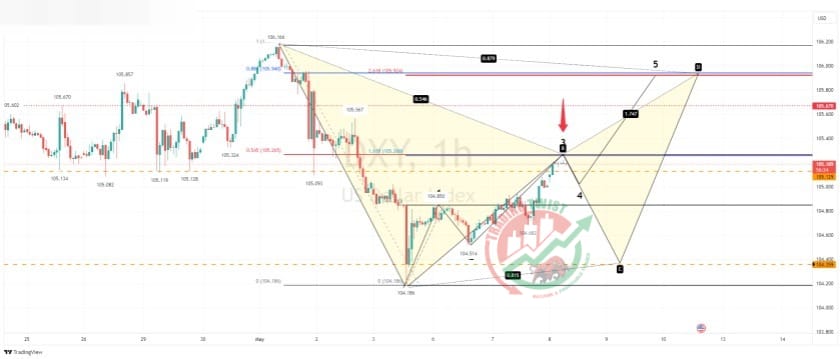
DXY Chart Technical Outlook (USD Index) – although the index has recovered over 50% of last weeks decline, we have a Fibonacci confluence level located at 105.26. This is a 161.8% extension level and the retracement level for the AB leg of a Bat formation. Although there is scope for mild gains, I look for a corrective move to the downside in either the 4th wave of a bullish Elliott Wave count (5 waves) or the BC leg of the Bat formation. Strong resistance is located at 105.67.