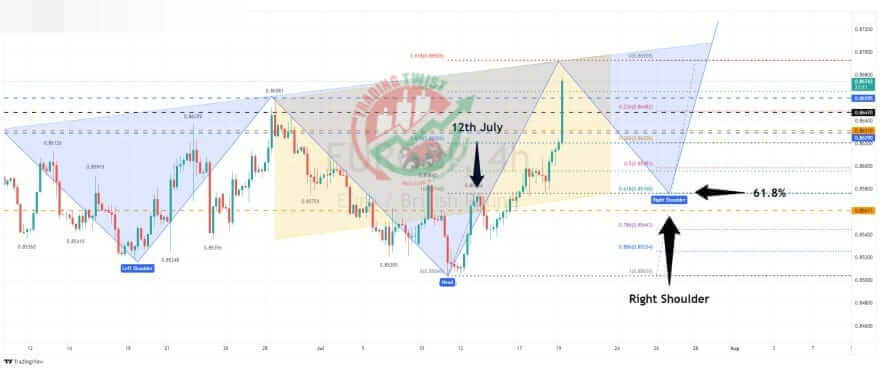
EURGBP Chart Technical Outlook sentiment flip to bullish, dips to be bought close to 0.8576
Lower-than-expected UK inflation figures have resulted in sterling (GBP) moving to the downside. There is no clear indication that this downward move in the single currency is coming to an end.
EUR/GBP 4hr chart – we have a 261.8% extension level located at 0.8692. This key Fibonacci extension level will often stall buying (profit-taking)
We would then expect the correction to find buyers close to 0.8576. This is:
- the previous resistance level from Wednesday the 12th of July. What was resistance, now becomes support.
- the projected 61.8% pullback level at 0.8576
- the potential right shoulder (channel base) of a reverse Head and Shoulders pattern.
The medium-term bias flips to the upside. We would look to buy dips close to 0.8576.


