
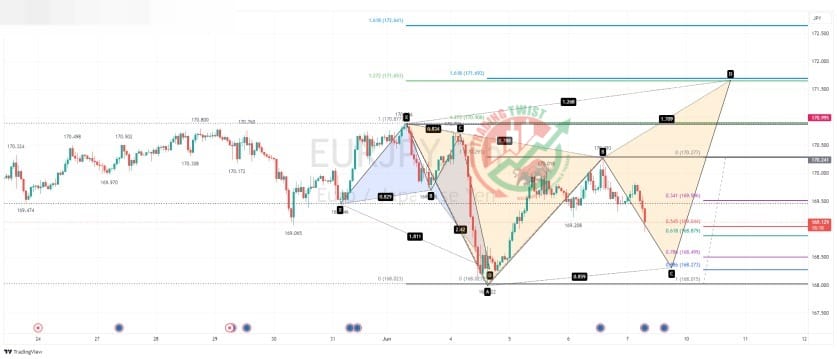
EURJPY Chart Technical outlook corrects slower within the BC leg
We have seen mixed trading results for the last two days with all price action confined to the June 4 range. These patterns are known as Inside Harami candles and highlight indecision. The intraday chart shows the pair moving lower within the BC leg of a Butterfly formation. A common retracement level is 88.6% of the last rally. This support is located at 168.27. The completion of the Butterfly Formation is located at 171.69. The pattern is negated on a move through the previous swing low of 168.02.


