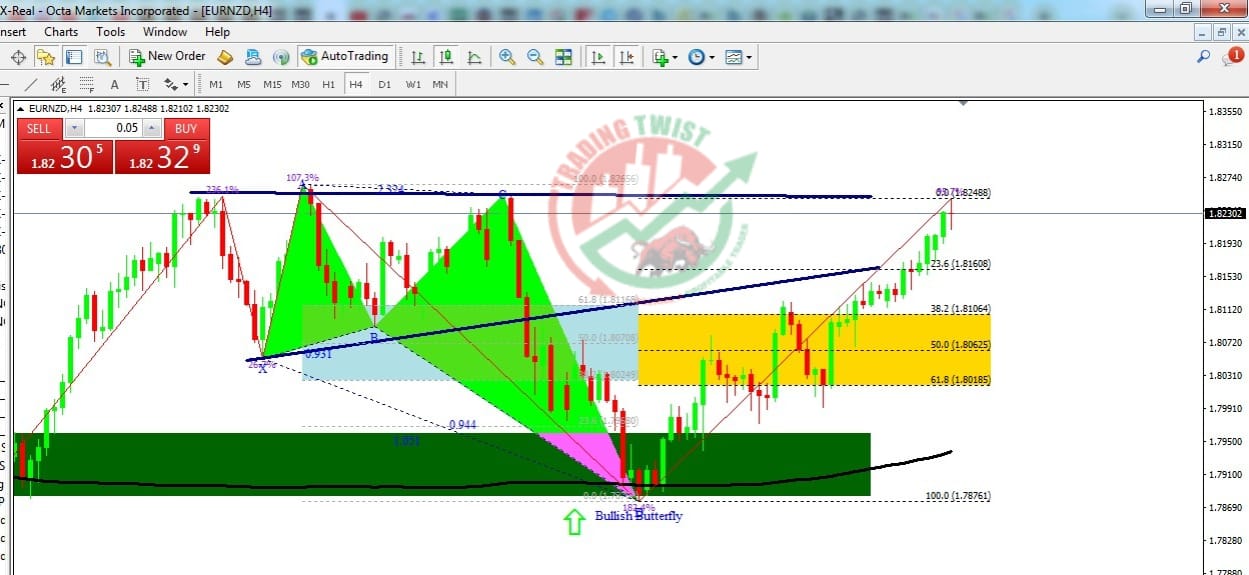
EURNZD Chart Technical Outlook on H4 time frame, market respecting Tripple top pattern, the range to extend until it is game-changing.
EUR/NZD strengthened on Monday as the focus turned to eurozone GDP and U.S. inflation data for more clues on the economic outlook. Preliminary third-quarter gross domestic product (GDP) data from the Eurozone will demonstrate the impact of rising interest rates on economic activity.
The is pair heading towards the 23.6%fib, as the near-term direction of the pair is likely to be driven by current price action.
Technical signals are bullish as RSI is at 62, and daily momentum studies 5,9, and 10 DMAs are trending up.
Immediate resistance is located at 1.8240( 23.6%fib), any close above will push the pair towards 1.8315 (5th Sep high)
Strong support is seen at 1.8137 (38.2%fib ) and a break below could take the pair towards 1.8100 (21DMA).
Recommendation: Good to buy around 1.8180, with the stop loss of 1.8060 and a target price of 1.8270