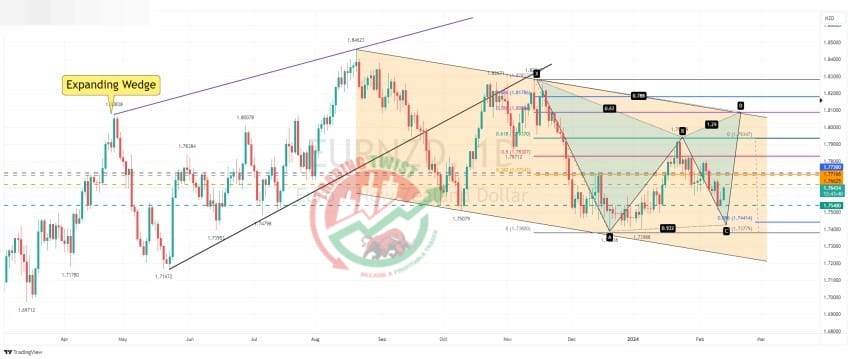
EURNZD Chart Technical Outlook building a bearish Gartley
The daily chart highlights the cross-building building of a bearish Gartley formation. What is difficult to analyze is whether we have completed the BC leg. With intraday resistance located at 1.7662, it would be unwise to buy at the current level. The 88.6% pullback level of the last rally is located at 1.7441. This is a common retracement.


