
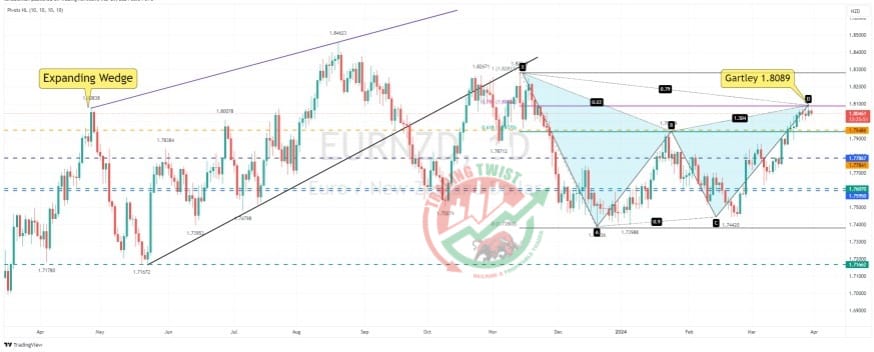
EURNZD Chart Technical Outlook completes a bearish Gartley at 1.8089
The cross has completed a bearish Gartley formation at 1.8089. The intraday chart highlights the scope to build a bearish head and shoulders pattern. On a break of 1.8035 (neckline), the measure move target is 1.7955. My system highlights buying dips at lower levels.
With regards to the money flow index (MFI), I believe this is a similar oscillator to the relative strength index but adds volume data to the calculation. As FX does not have volume, I’m unsure how effective the indicator is for foreign exchange.


