
EURUSD Chart Technical Outlook 1.0741 offers a solid upside barrier
EUR basket – although we have broken through the accumulation range to the upside, I expect this rally to fail. We can also note an ascending wedge pattern that has a bias to break to the downside. All eyes will be on the Eurozone GDP figure (gross domestic product).
Correlation studies suggest more downside for EUR/USD, with rallies to be sold.
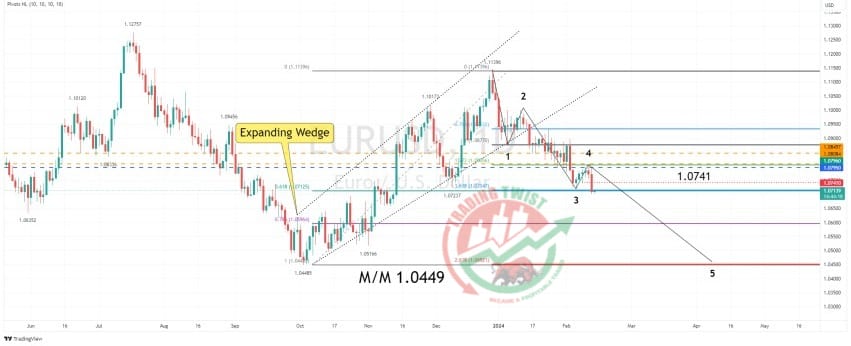
EUR/USD – the daily chart highlights the 4th wave correction (Elliott Wave) complete. We are now in the choppy 5th wave lower. Previous support from Thursday, February 8 is located at 1.0741. What was support, becomes resistance. Yesterday’s Marabuzo level (midpoint from open and close of a strongly bearish candle – daily), is located at 1.0741.
Conclusion: there is ample scope for an upside profit-taking correction. With a confluence level located at 1.0741, I would look to this zone to attract selling interest. The next substantial support is located at 1.0655.
*Resistance: 1.0741 (confluence), 1.0788 (bespo


