
EURUSD Chart Technical Outlook the Ending Wedge could offer a selling opportunity at higher levels
The weekly chart highlights the major currency pair moving lower within the BC leg of a large Gartley formation. A common retracement is the 88.6% pullback of the last rally. This level is located at 0.9742.
Last week’s impulsive selling pressure has resulted in a bearish Marabuzo level of 1.0740. This is the midpoint of a strongly negative candle. We have the previous swing low from April 2 at 1.0725. What was support now becomes resistance. I look to this zone as a substantial upside barrier (1.0725-1.0740)
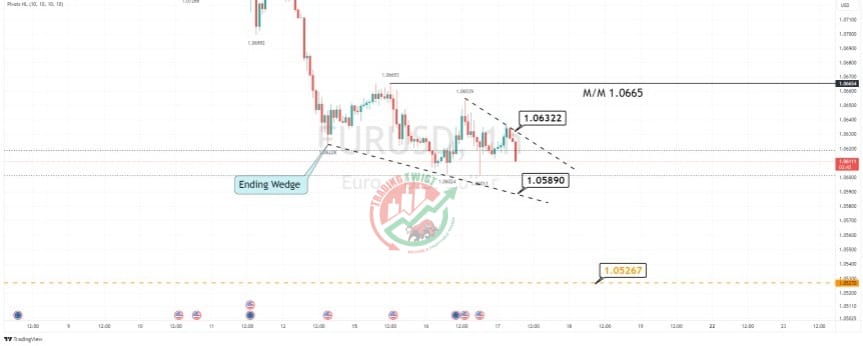
Mixed and volatile intraday trading has resulted in an ending wedge formation being posted on the one-hour chart. Trend line support is located at 1.0589. On a break of trendline resistance at 1.0632, the measured move target is 1.0665. Bespoke support is located at 1.0527
Resistance: 1.0632 (trend line), 1.0665 (measured move), 1.0740 (Marabuzo)
Support: 1.0589 (trend line), 1.0527 (bespoke), 0.9742 (88.6%)


