
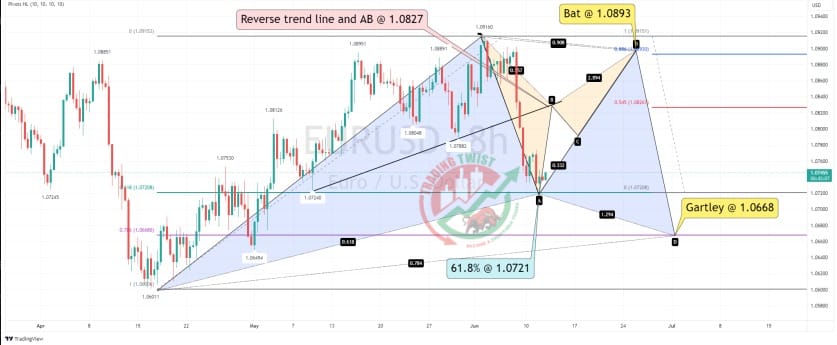
EURUSD Chart Technical Outlook stalls at the 61.8% Fibonacci level
‘Super Wednesday’ has arrived. We are expecting high volatility across all USD assets.
From a technical perspective, the EUR/USD pair offers interesting formations.
We have stalled close to the 61.8% pullback level of 1.0721. This is a common retracement point for the AB leg of a Gartley formation. On the upside, we have reverse trendline resistance located at 1.0827. This coincides with the projected AB leg of an internal Bat formation. This pattern is projected to complete at 1.0893. In conclusion, the bias is mildly bullish. The first upside barrier is located at 1.0827 followed by 1.0893


