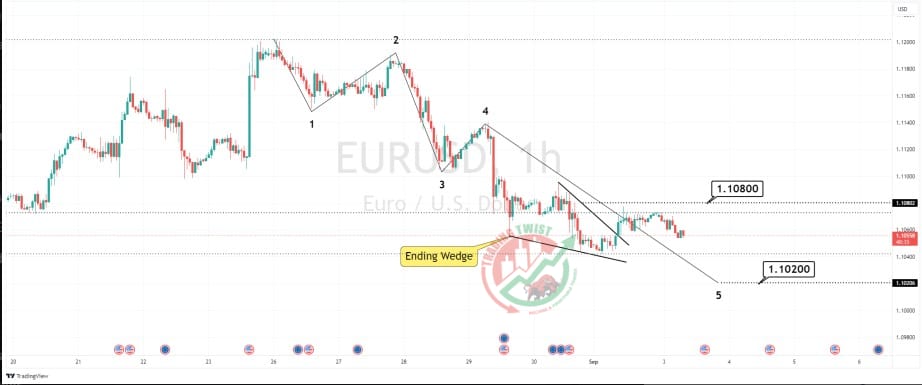
EURUSD Chart Technical Outlook produces a false breakout, next support is seen at 1.1020
Mild buying pressure resulted in the major currency pair breaking the sequence of three negative daily performances.
Although the one-hour chart highlights a breakout of an ending wedge formation, this is analyzed as false.
The next downside support level is located at 1.1020. Intraday resistance is located at 1.1077.
We are currently assessed as within the 5th wave of a bearish Elliott Wave count.
Conclusion: I can see no clear indication of an immediate change in trend. I look for continued downward pressure to 1.1020.
Resistance: 1.1077 (point of control), 1.1095 (wedge target), 1.1105 (swing low)
Support: 1.1042 (swing low), 1.1020 (bespoke), 1.1002 (demand)


