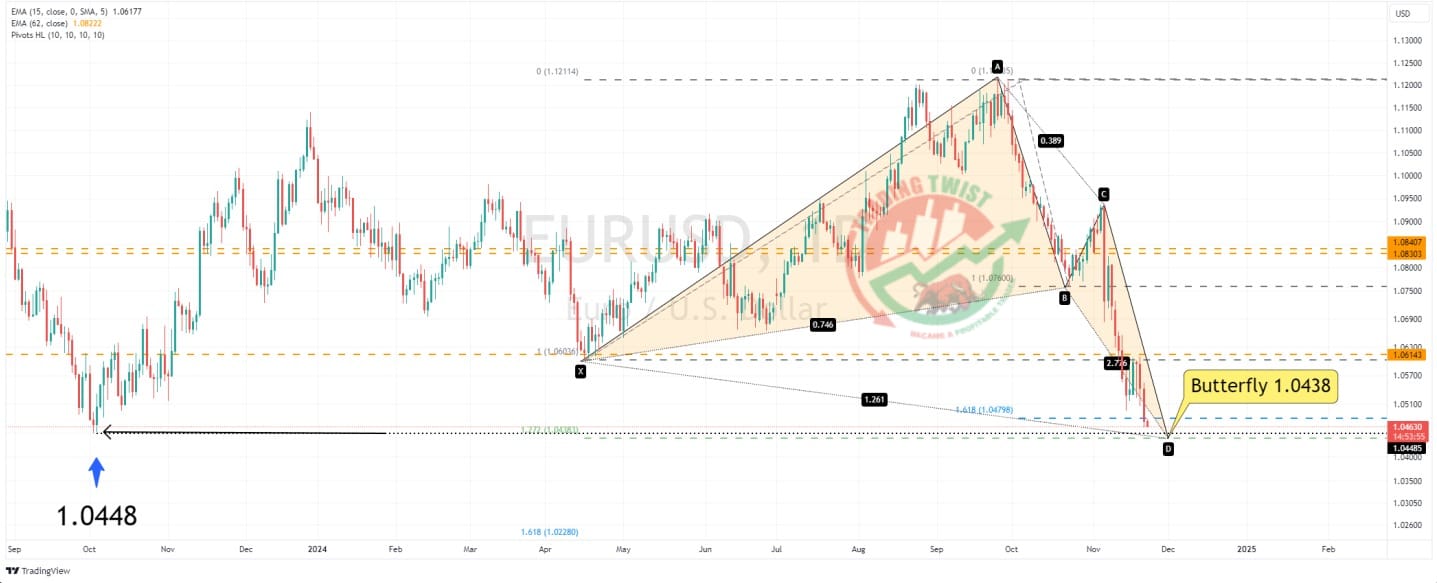
EURUSD Chart Technical Outlook correlation suggests a limited downside, prime support is located at 1.0438.
The daily chart highlights the completion of a bullish Butterfly formation at 1.0438. The previous swing low from October 3, 2023, is at 1.0448.
If we look at the intraday chart, we are within the 5th and final leg of a bearish Elliott Wave count (5 waves).
The USD Index (DXY) highlights the breakout of a channel formation. This can also be analysed as a bullish Flag. The measured move target is 107.12. The Euro basket suggests buying dips.
Conclusion: correlation studies suggest buying dips in EUR/USD. The first resistance barrier is located at 1.0614 followed by substantial resistance at 1.0830. It should be noted that a break of the previous swing low of 1.0448 will take out stops (institutional accumulation).
Resistance: 1.0561 (reverse trend line), 1.0614 (bespoke), 1.0830 (bespoke)
Support: 1.0448 (medium-term swing low), 1.0438 (butterfly), 1.0276 (intraday 261.8%)


