
GBPAUD Chart Technical Outlook moving higher within the BC leg
The weekly chart highlights the cross moving higher within the BC leg of a Bat formation. A common retracement is 88.6% of the last decline. This level is located at 1.9810.
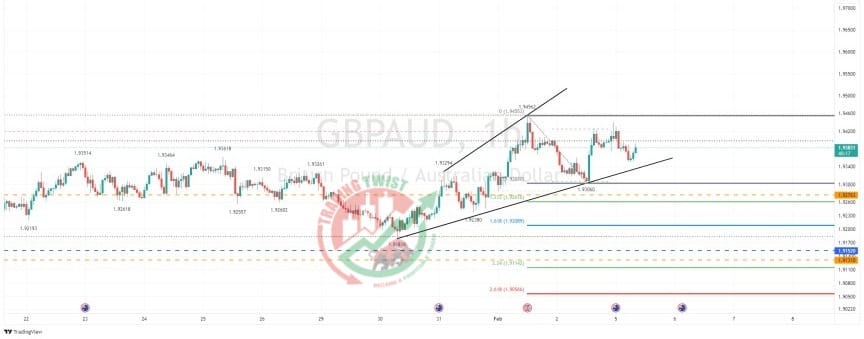
The intraday chart highlights an expanding wedge pattern, offering a warning sign of a potential downside correction. With bespoke support located at 1.9152 and 1.9131, I would look for dips to be bought within this zone.


