
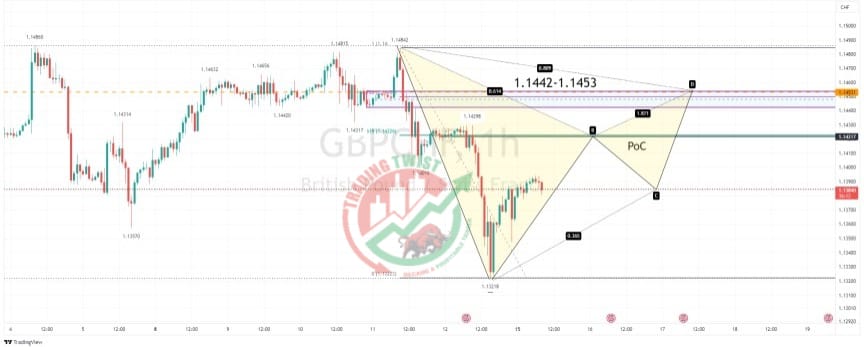
GBPCHF Chart Technical Outlook two areas of interest to the upside
The daily chart highlights a bearish outside candle from the high. This formation will often indicate the top of the trend and the start of a new downward bias.
The intraday time frame highlights the scope for a higher correction. We have two areas of interest:
- 1.1422 is the 61.8% pullback level of the last decline. 1.1422 is the point of control (PoC) from April 11.
- 1.1453 is bespoke resistance. We have a supply zone between 1.1442 and 1.1453. The 78.6% pullback level is located at 1.1450.
Conclusion: there is ample scope for an upside correction. I would look for a potential bearish Gartley formation to complete at the areas of interest.


