
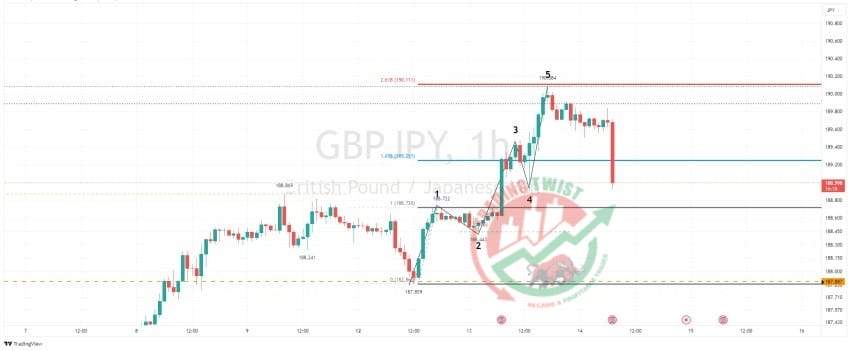
GBPJPY Chart Technical Outlookthe bias flips to bearish, calling a top
GBP Basket – lower-than-expected inflation data has resulted in sterling (GBP) moving to the downside. The basket highlights the completion of a bearish Gartley formation.
JPY Basket – moving lower within a Crab formation. This will be completed at 6,418. We are seeing a correction to the upside close to the 161.8% extension level of 6,530. Elliott Wave enthusiasts would see this as a fourth-wave correction before sellers return.
Correlation studies highlight the potential for a top in GBP/JPY. With both single currencies moving in the same direction (bearish) intraday trading should be mixed and volatile.
GBP/JPY – the weekly chart highlights the breakout of an ending wedge formation. This pattern has a measured move target of 158.27. Using projection analysis from our bespoke support level at 178.43, we have a 261.8% extension level at 157.95.
The daily chart highlights a Wyckoff distribution phase. The break to the upside is analyzed as an upthrus


