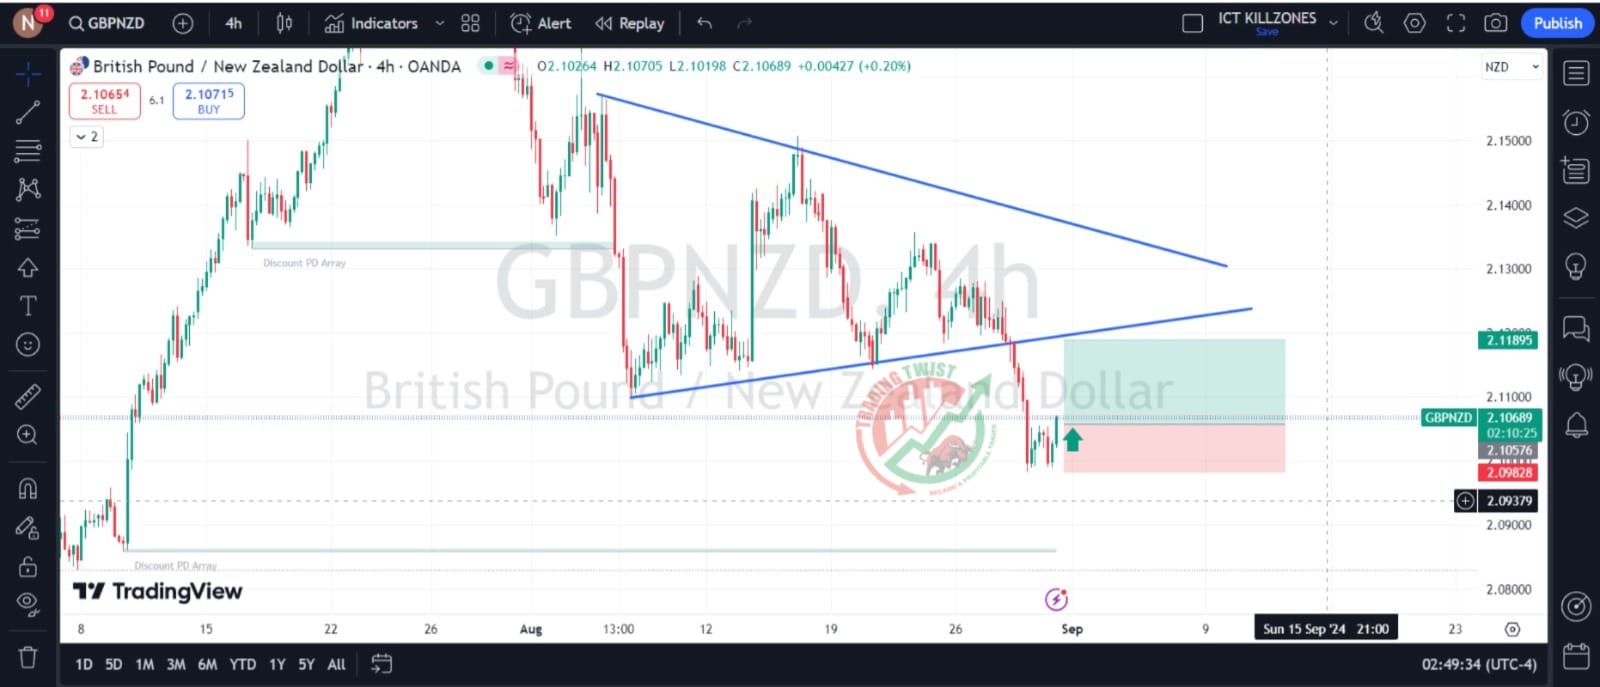
As of August 30, 2024, GBPNZD Chart Technical Outlook the GBPNZD pair on the H4 timeframe appears to be in a sideways trend.
Key Observations:
- Price Action: The price is currently trading within a range, indicating indecision among market participants.
- Moving Averages: The 50-day and 200-day moving averages are relatively close together, suggesting a potential trend change.
- Relative Strength Index (RSI): The RSI is hovering near the neutral level of 50, indicating neither a strong bullish nor bearish bias.
Potential Scenarios:
- Breakout: A break above the upper resistance level of the consolidation range could signal a bullish trend resumption.
- Breakdown: A break below the lower support level of the consolidation range could indicate a bearish trend reversal.