
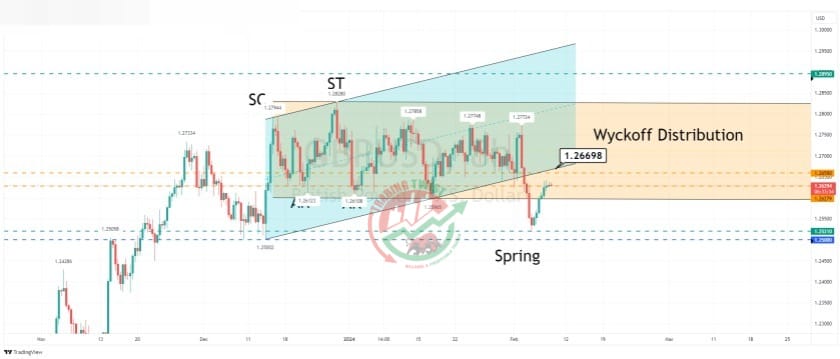
GBPUSD Chart Technical Outlook 1.2659 could stall the buying pressure today
GBP Basket – the intraday chart lights the basket trading within a corrective channel formation. This pattern has an eventual bias to break to the upside. With bespoke support located in 1993 and the channel base located in 1984, our preferred stance would be to buy into deep dips.
DXY (USD Index) – we have seen a correction to the downside. Support levels are located at 103.20 and 103.18. With the 61.8% Fibonacci support located at 103.19, I look for dips to be bought.
Correlation studies suggest a mild bullish bias for GBP/USD. The preferred stance would be to buy into dips.
GBP/USD – the 8-hour chart highlights mixed and volatile trading. We have reverse trendline resistance from the bullish channel formation located at 1.2670. Bespoke resistance is located at 1.2659.
The intraday chart highlights 1.2658 as the projected AB barrier for a Bat formation. It should also be noted that a five-wave count from this resistance zone would offer a 261.8%


