
GBPUSD Chart Technical Outlook continues to move higher within the wedge formation
Correlation studies suggest selling GBP/USD at higher levels.
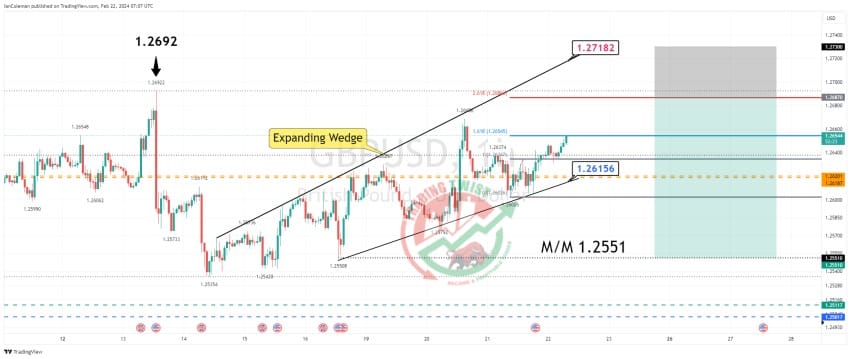
GBP/USD – mixed and volatile intraday trading has resulted in an expanding wedge formation being posted on the intraday chart. On a break of 1.2615, the trend of higher lows, the measured move target is 1.2551. We have a 261.8% extension level located at 1.2687. The previous swing high from Feb 13 is located at 1.2692. Trendline resistance is located at 1.2718.
Resistance: 1.2687 (261.8%), 1.2692 (swing high), 1.2718 (trend line)
Support 1.2620 (bespoke), 1.2615 (higher lows), 1.2551 (measured move)


