
GBPUSD Chart Technical Outlook sits at a crossroads
GBP/USD – bespoke support is located at 1.2540 and 1.2532.
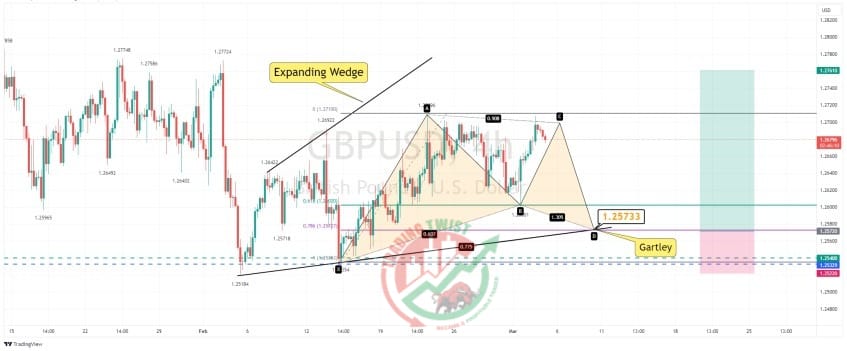
The 8-hour chart highlights the completion of a bearish Gartley formation at 1.2761. This would suggest we are either in the BC leg to the downside OR the BC leg has been completed at 1.2600 and we are in the CD leg higher.
The four-hour chart highlights the pair trading within an Expanding Wedge formation. The trend of higher lows is located at 1.2573. A move to 1.2573 will form a bullish Gartley pattern.
Resistance: 1.2710 (swing high), 1.2761 (8-hour Gartley), 1.2772 (Feb peak)
*Support: 1.2573 (4 hour Gartley), 1.2540 (bespoke), 1.2532 (bespoke)


