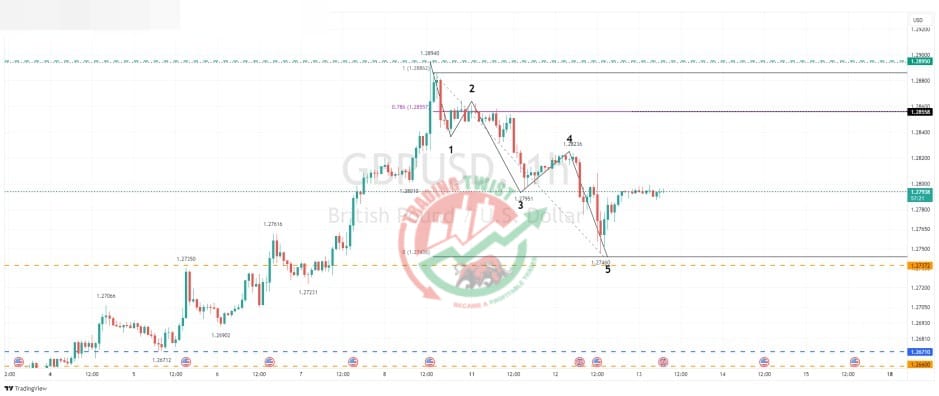
GBPUSD Chart Technical Outlook is correcting higher in the 2nd wave
GBP Basket – mixed and volatile price action has formed a bearish ending wedge pattern on the daily chart. The four-hour chart highlights a possible negative head and shoulders pattern. The analysis would suggest selling into rallies.
GBP/USD – bespoke support is located at 1.2660 and 1.2532. Using projection analysis, this lines up with a bearish Elliott Wave count (5 waves). That would suggest that we are currently in the choppy and corrective wave 2. The intraday chart highlights a five-wave count completing at 1.2746.
Resistance: 1.2820 (projected AB), 1.2831 (61.8%), 1.2855 (78.6%)
Support: 1.2746 (swing low), 1.2653 (bespoke and 161.8%), 1.2534 (bespoke)