
GBPUSD Chart Technical Outlook The rally stalls at the supply zone
Worse than expected ISM services PMI data sent the US Dollar tumbling yesterday (exp. 52.7 act. 51.4)
GBP Basket – offers a mild downward bias with the next substantial support level located at 2,204. I would expect mixed and volatile trading.
GBP/USD – the 8-hour chart highlights buyers returning in front of the completed butterfly formation at 1.2520. We are now at a critical junction. A move through the previous swing low at 1.2668 will break the structure (Elliott Wave).
The one-hour chart highlights a supply zone from March 22 and March 26. We have a 261.8% extension level located at 1.2651.
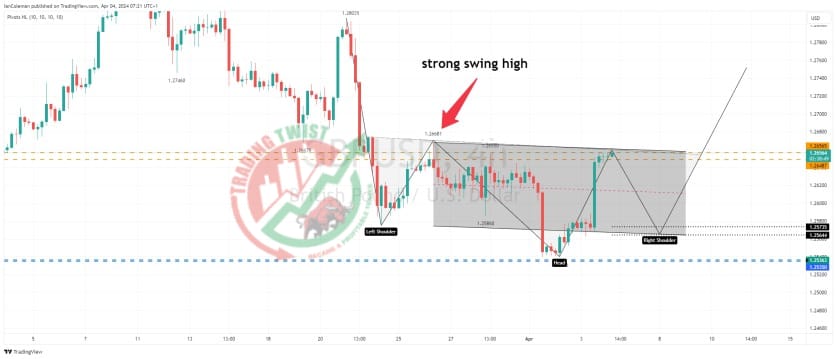
The four-hour chart highlights a strong swing high at 1.2668. The current support zone in this time frame is located at 1.2573 to 1.2564.
Resistance: 1.2656 (bespoke), 1.2668 (break of structure), 1.2803 (swing high)
Support: 1.2590 (SMAC), 1.2573 (bespoke), 1.2564 (bespoke)


