
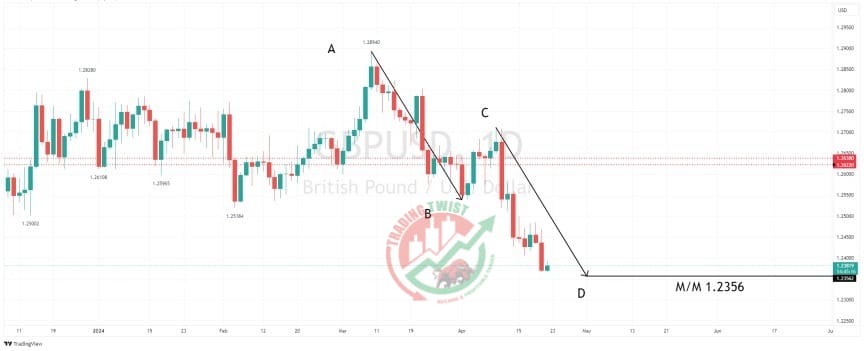
GBPUSD Chart Technical Outlook AB=CD formation will be completed at 1.2356
Sellers emerged at 1.2468 with follow-through negative momentum resulting in the pair trading to the lowest level in 110 (trading) days.
The daily chart highlights the completion of an AB=CD formation located at 1.2356.
Bespoke resistance is located at 1.2638. Using 1.2356 as a projected swing low, we have a 78.6% pullback level located at 1.2637. The 61.8% pullback level is located at 1.2575.
The four-hour chart highlights an ending wedge formation with an eventual bias to break to the upside. On a move through the trend of lower highs at 1.2454. The measured move target is 1.2578
Resistance: 1.2454 (lower highs), 1.2578 (measured move), 1.2638 (bespoke)
Support: 1.2366 (swing low), 1.2356 (AB=CD), 1.2037 (Oct base)


