
GBPUSD Chart Technical Outlook make or break for Sterling
Tonight we have the FOMC minutes. Investors will be looking for clues about the policy outlook and the vote split.
It was a good time to look at the Big Picture analysis as it looks like make or break for sterling (GBP/USD).
The monthly chart highlights a large Crab formation. The big question is ‘Has the BC leg been completed’. A break of the previous swing high from July 23 is located at 1.3142, suggesting we’re moving higher within the CD leg. A rejection of this rally suggests that the BC leg will be deeper.
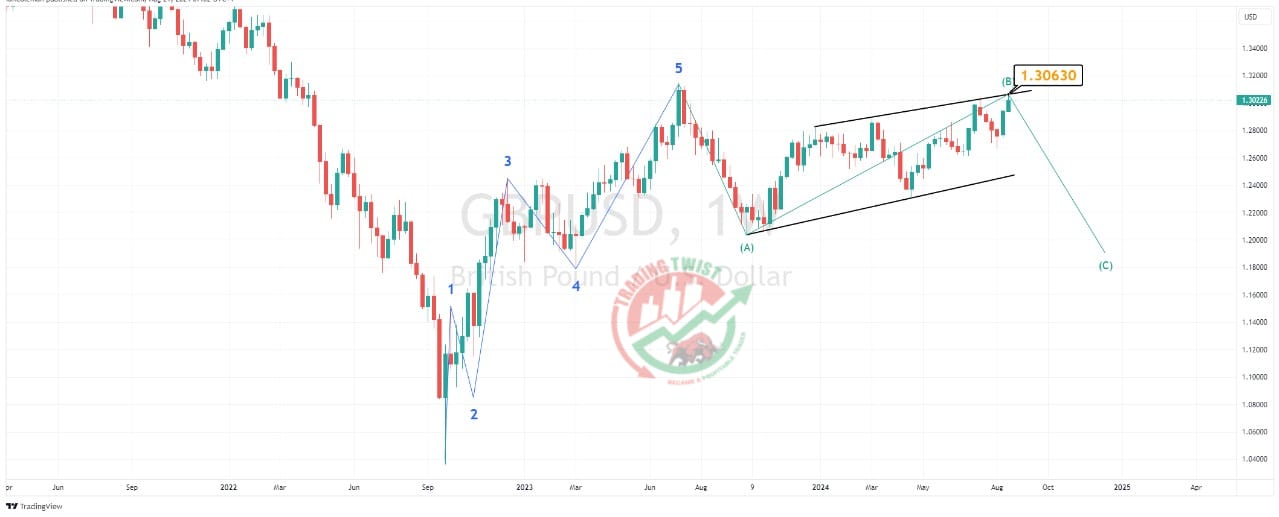
The weekly chart highlights a bullish Elliott Wave count (5 waves). This will normally be followed by an ABC correction. I can only clearly see two corrective waves. The trend line resistance from a bearish ending wedge formation is located at 1.3063
Intraday support is located at 1.2980


