
GBPUSD Chart Technical Outlook awaits clues from the US inflation data
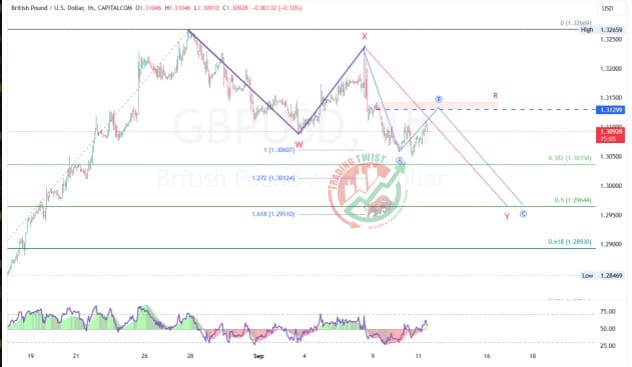
GBP/USD prints a downside corrective structure, WXY. Wave B of Y is in play, with room for limited gains toward 1.3130. Today’s US inflation data should be watched closely. The disinflation is expected to continue and print 2.6% versus the prior figure of 2.9%. This is the last inflation data ahead of the most important Fed meeting on September 18. There is a debate about whether they may cut 25bps or 50bps. The job market has shown weakness recently. If disinflation continues as expected, the pair can extend higher. A downside price action will be focused on if the figure is higher than expected. Supports are located at 1.3035 and 1.2965.


