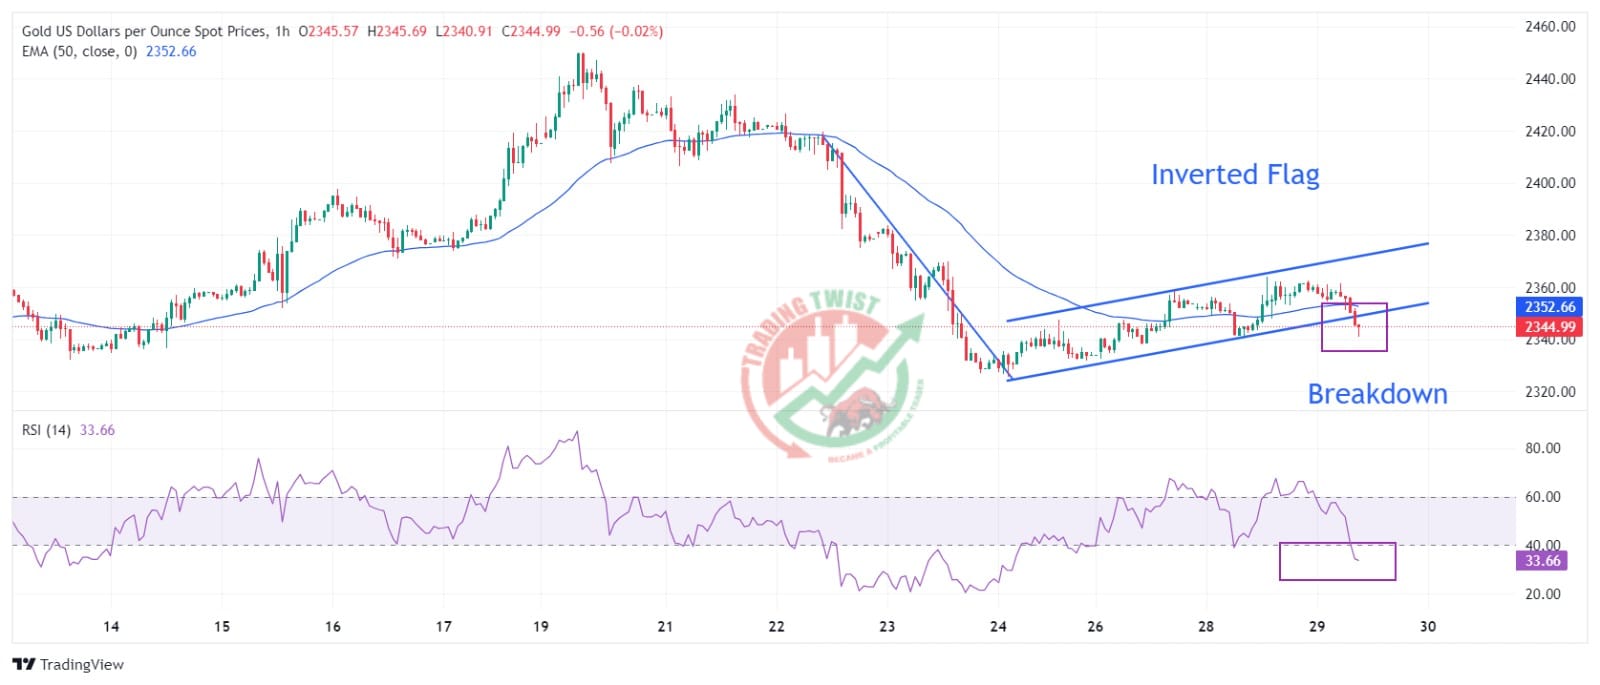
Technical Analysis: GOLD Chart Technical Outlook price delivers an inverted flag breakdown
Gold price weakens after the breakdown of an Inverted Flag chart formation on an hourly timeframe. A breakdown of the above-mentioned chart pattern suggests that the downside trend has resumed after the entry of fresh sellers. The near-term outlook is uncertain as the Gold price has slipped below the 50-period Exponential Moving Average (EMA), which trades around $2,350.
The 14-period Relative Strength Index (RSI) has shifted into the bearish range of 20.00-40.00, suggesting that a bearish momentum has been established.
If the Gold price breaks below the May 24 low of around $2,320, more downside will appear. However, a recovery move above the May 28 high of around $2,365 would put bulls in the driving seat.