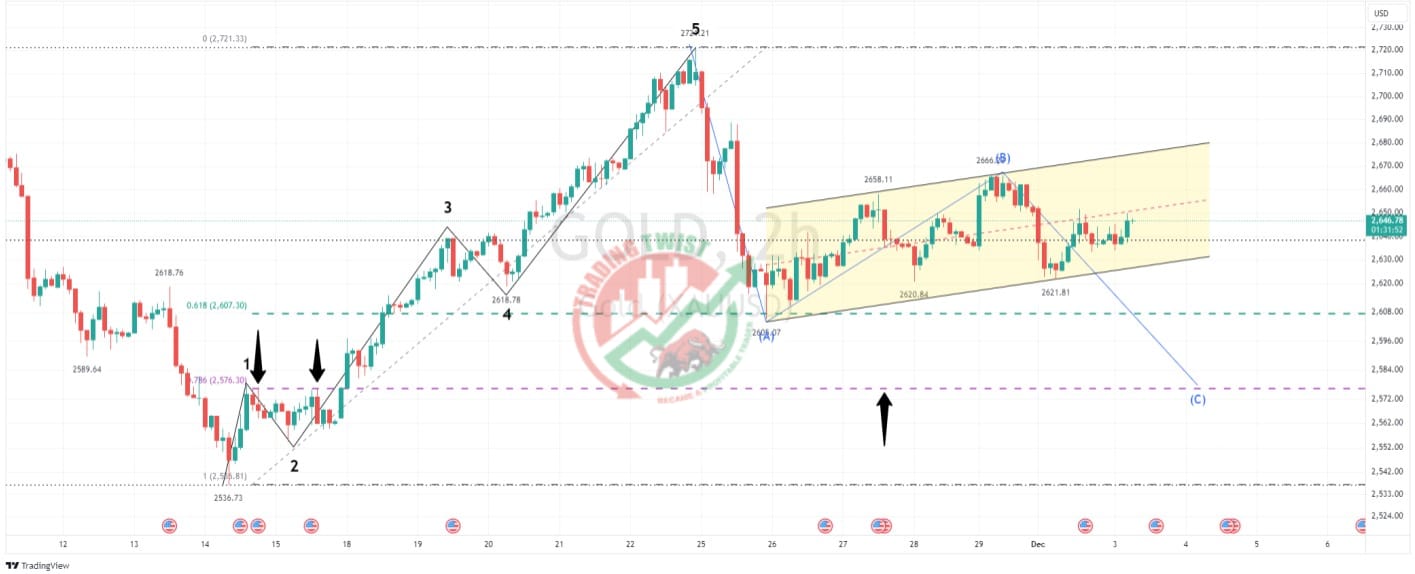
Gold XAUUSD Chart Technical Outlook Gold holds with a corrective channel formation, trend line resistance at $2,674.
The daily chart shows spikes in both directions for the last five sessions highlighting investor indecision.
The four-hour chart is building a Crab formation. This pattern will be completed at $2,950. We are currently within the corrective and choppy BC leg. We have a demand zone from November 15 at $2,571.
The intraday chart highlights the last move higher in five waves. Elliott Wave analysis suggests we are currently within the corrective ABC leg lower. The mixed price action on the daily chart has resulted in a corrective channel formation being posted in this time frame. A move to $2,576 would complete a bullish cypher pattern known as a Gartley.
Conclusion: Trading will remain mixed and volatile within the corrective channel formation. Prime support is located at $2,576. The medium-term target and completion of the Crab Formation is $2,950.
*Resistance: $2,674 (channel top), $2,721 (swing high),


