
Gold XAUUSD Chart Technical Outlook caution for bulls as we trade within the 5th wave Ending Wedge
We have seen a sustained move to the upside after completing the bullish Butterfly formation at $1,985.
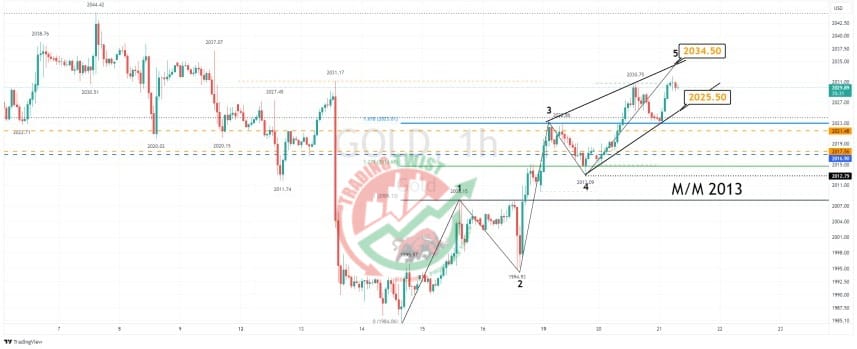
The intraday chart highlights the commodity moving higher within the 5th wave of a bullish Elliott wave count (5 waves). Price action has formed a bearish Ending Wedge pattern. Trendline resistance is located at $2,034.5. On a break of trendline support at $2,025.5, the measured move target is 2013.
Looking out to a higher time frame we have a 61.8% pullback level at $2,034.
Conclusion: with a confluence level at $,2034, it would suggest that rallies will be limited. The 8-hour chart highlights a move lower within the bearish BC leg of a Gartley formation. Selling at $2,034 (confluence), targeting $2,002 (swing low), with a stop loss of $2,040 (above the supply zone), offers a risk-reward factor of 5.33R.
Resistance: $2,034 (confluence), $2,037 (supply zone), $2,048 (projected Gartley)
*Support $2,017 (bespoke), $2,002 (swing


