
GOLD XAUUSD Chart Technical Outlook highlights two topping formations
Fed’s Kashari and Goolsbee noted that it is possible the Fed will not cut this year if inflation stalls (stays high). This resulted in U.S. stocks moving to the downside and a run to safe-haven assets.
GOLD – we witnessed mixed volatile trading toward the end of Thursday’s session. The two-hour chart highlights the completion of a bullish Elliott Wave count (5 waves) at the $2,306 swing high. This was completed with an ending wedge formation. A common pattern in the Elliott Wave theory. The reverse trendline resistance is located at $2,297.
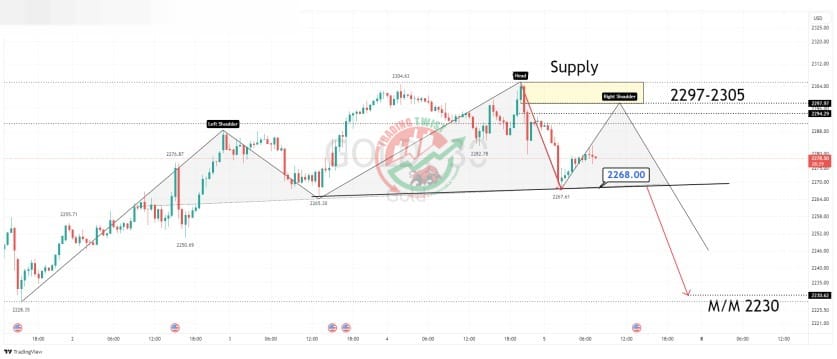
Another common topping formation in the Elliott Wave theory is a head and shoulders formation. Resistance is located at $2,294 and $2,297. Yesterday’s supply zone is located between $2,297 and $2,305. This formation has a measured move target of $2,230.
Conclusion: there is ample scope for an upside correction to sell into. I look to $2,297 as prime resistance. A break of the previous swing high at $2,306 negates this view.


