
Gold XAUUSD Chart Technical Outlook created a double bottom at $2,315, bulls may push it toward $2,365 on further weak data.
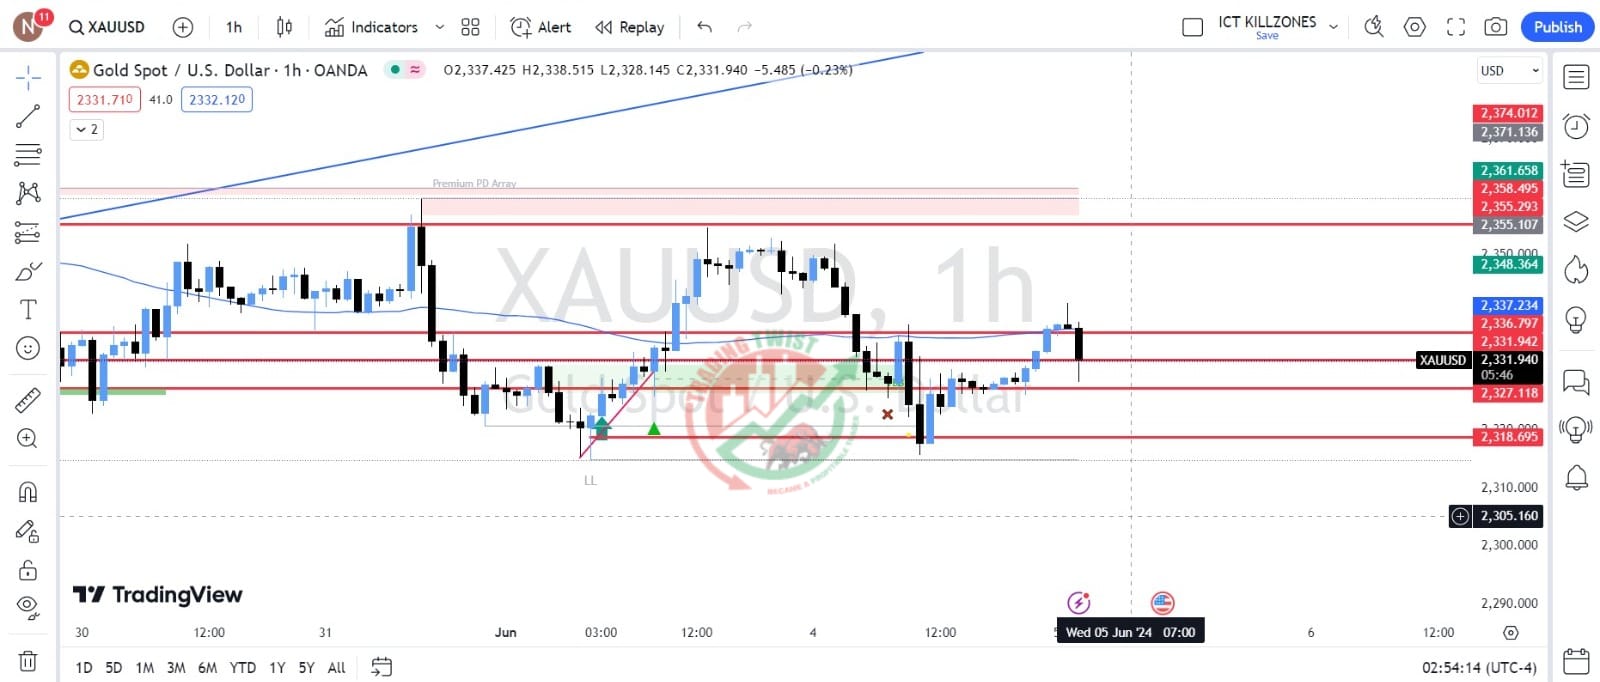
XAU/USD is trading in a clear range, with $2,365 holding it down and $2,315 working as a double bottom., after being hit yesterday. It can be seen as a descending triangle, a bearish pattern, or a bullish one, with the double-bottom showing the path of least resistance up.
Resistance is at $2,352, $2,365, and $2,407. Support is at $2,315, $2,303, and $2,278.
So, bullish or bearish? I expect Gold to catch up with fundamentals – which point higher for the precious metal. The JOLTs report came out at 8.07 million annualized hirings, under projections, and the lowest since 2021. It came on top of Monday’s soft ISM Manufacturing PMI.


