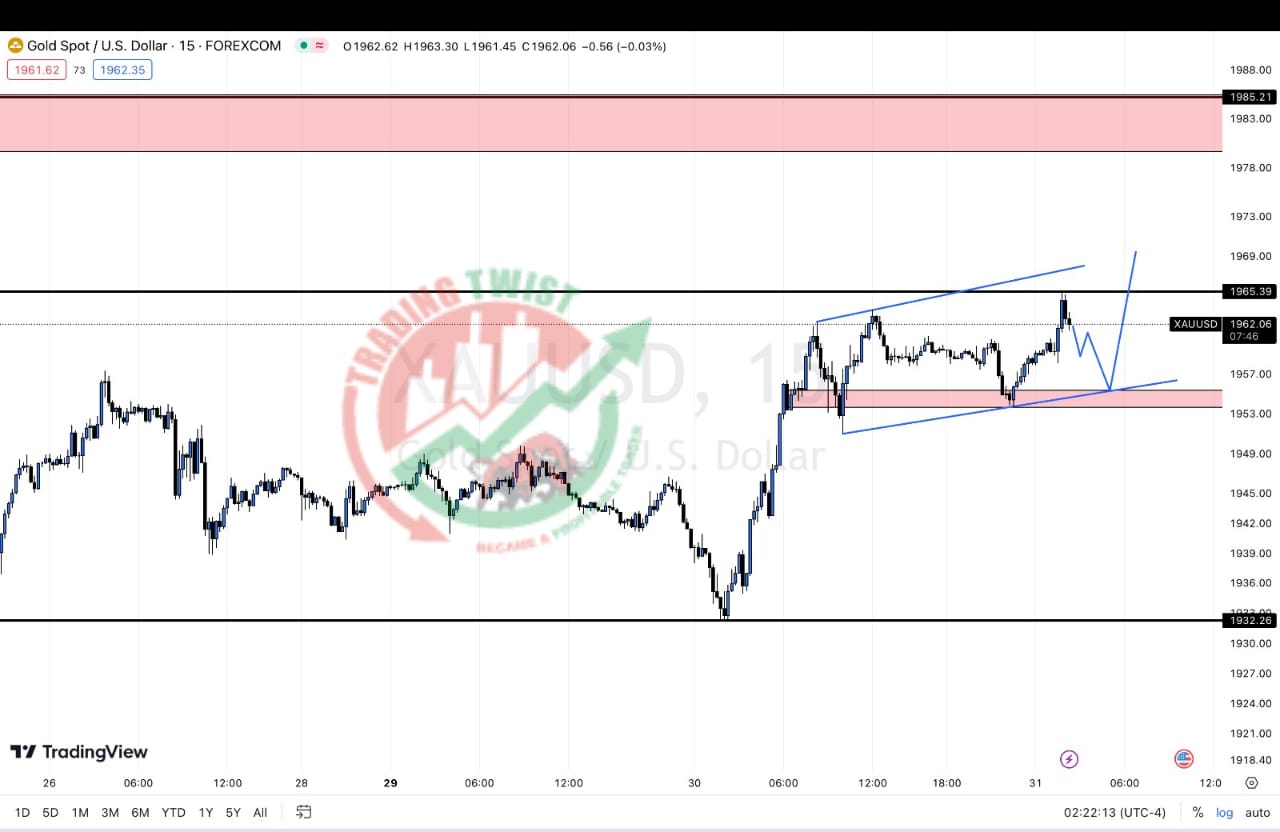
The XAUUSD chart refers to the price movement of gold against the US dollar in the financial markets. Analyzing the technical outlook of the XAUUSD chart involves assessing various indicators and patterns to predict potential price movements in the future.
At the time of writing, the XAUUSD chart shows a bullish trend. Gold prices have been steadily rising against the US dollar, indicating strong demand for the precious metal. This upward movement is supported by several technical factors.
Firstly, the moving averages provide an indication of the overall trend. The 50-day moving average has crossed above the 200-day moving average, which is known as a golden cross, signaling a bullish sentiment. This crossover suggests that the shorter-term price momentum is now stronger than the longer-term momentum.
Secondly, the chart shows a series of higher highs and higher lows, forming an upward trendline. This indicates that buyers have been consistently entering the market at higher price levels, showing increased confidence in gold’s value.
Furthermore, key resistance and support levels are important in technical analysis. Resistance levels represent price levels where selling pressure may emerge, potentially causing a temporary halt or reversal in the upward movement. Conversely, support levels are price levels where buying interest may increase, providing a floor for the price.
In terms of resistance, the XAUUSD chart shows a significant level of around $1,900 per ounce. If gold prices manage to break above this level, it could open the door for further gains toward the next resistance around $2,000 per ounce.
Therefore, it is crucial to combine technical analysis with fundamental analysis and stay updated with relevant news and events that could impact the gold market. By doing so, traders can make more informed decisions when trading XAU/USD and potentially improve their chances of success.


