
GOLD XAUUSD Chart Technical Outlook combined Fibonacci levels suggest a downside correction
Strong buying pressure on Friday resulted in Gold breaking the previous all-time high of $2,484. Signals for sentiment are now at overbought extremes.
Other USD-denominated products suggest limited selling in DXY (the USD Index). Correlation would suggest limited upside pressure for Gold.
From a technical perspective, we have a Fibonacci 261.8% extension confluence zone between $2,506 and $2,509.
• The four-hour chart highlights a 261.8% extension level located at $2,506. We can see the completion of a bullish Elliott Wave count (five waves). We can also note an ending wedge formation. On a break of trendline support at $2,451, the measured move target is $2,380.
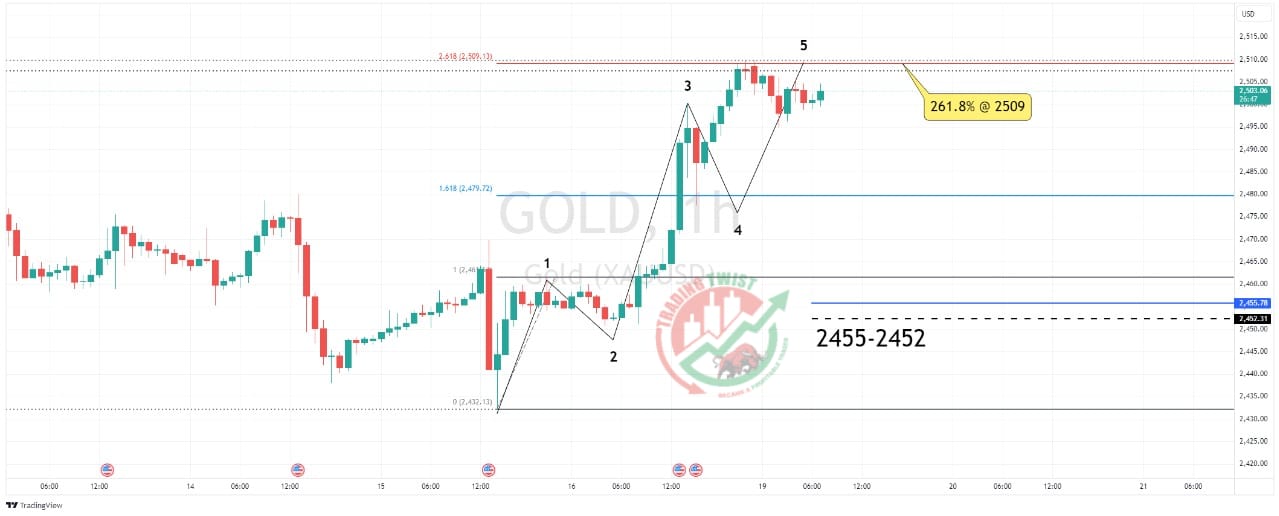
• The one-hour chart highlights a 261.8% extension level at $2,509.
Intraday support is not seen until $2,455-2,452.
Resistance: 2506 (261.8%), 2509 (261.8%), 2512 (trend line)
Support: 2455-52 (intraday), 2451 (higher lows), 2380 (measured move)


