
GOLD XAUUSD Chart Technical Outlook Gold posts a mixed picture going into the FOMC minutes.
The 8-hour chart highlights gold within an ending wedge formation. For this to be regarded as a strong negative pattern we need to see a bearish divergence on an oscillator. The relative strength index (RSI) highlights equal highs, weakening the pattern. A full AB=CD formation is located at $2,548. This chart highlights further gains that are to be limited.
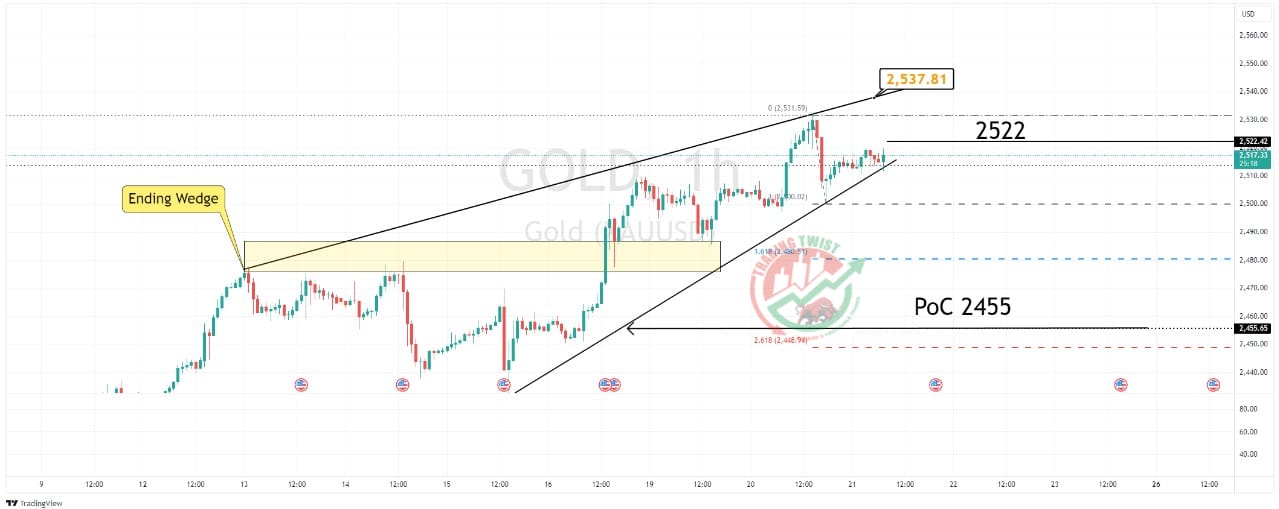
The one-hour chart highlights an ending wedge formation. Using the Fibonacci extension tool, the 161.8% level lines up with previous support and resistance. The 261.8% level is close to the point of control from August 16. Intraday resistance is located at $2,522. Trendline resistance is located at $2,538.
Dips continue to find buying interest. However, I look for continued rallies to be limited. A break of yesterday’s swing low at $2,500 and the correction lower is underway.


