
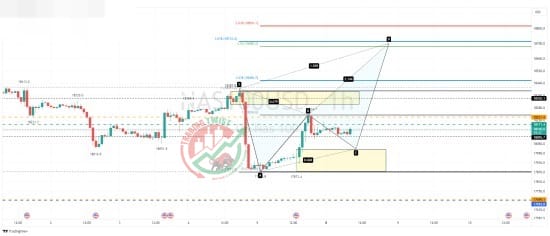
Nasdaq 100 (US100) Chart Technical Outlook dips to be bought. The daily chart highlights mixed trading results for the last 24 days. This clearly shows indecision as the market tries to anticipate the Fed’s next move.
The intraday chart highlights a Crab formation completing between 18,680 and 18,712. That would suggest that intraday dips will find buying interest. We have a previous supply zone located at 18,011.


