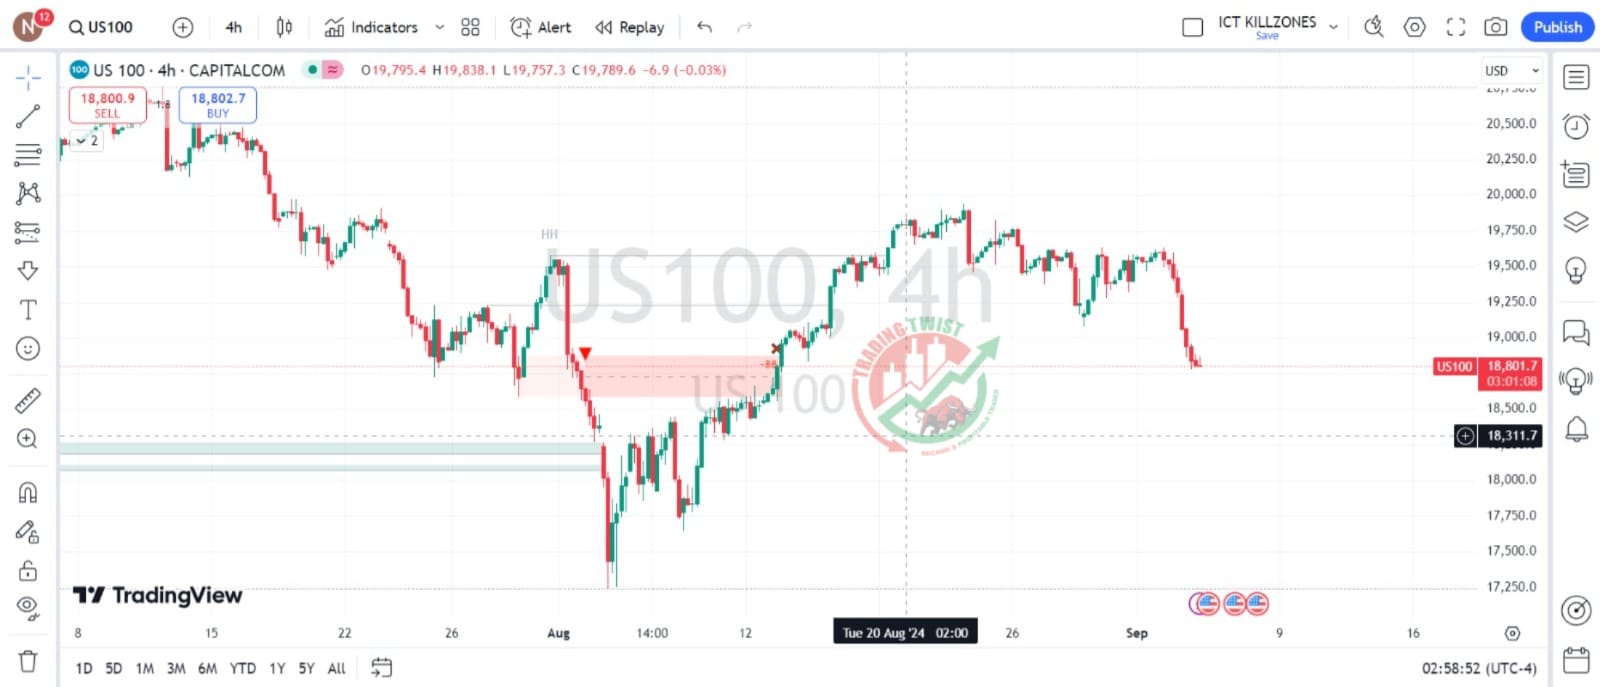
NASDAQ US100 Chart Technical Outlook trades close to a support zone while oversold, eyeing a bottom
Nasdaq builds an extended corrective structure to the downside. Wave Y is in play, with supports at the 50% and 61.8% Fibo retracement levels, 18,780-18,250. Prices are oversold—a lower spike is expected and can show a bullish divergence. The risk appetite is skewed to the downside, eyeing further clues from today’s JOLTs report. I expect the dip to find buyers and support prices going into this Friday’s NFP. Resistances are located at 19,080 and 19,250.