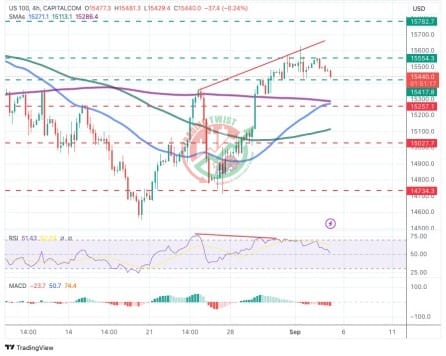
Nasdaq (US100) Chart Technical Outlook likely to correct lower on a risk-off market, Nasdaq (US100) uptrend from late-August lows is losing steam, as shown by the bearish divergence seen in the 4h RSI and the Doji-style candles printed on the daily chart which often signals a trend change.
The cautious market sentiment was seen on Tuesday, with US market futures pointing out tom a negative opening might help bears to push the index below 15,415 support looking for the confluence of the 4h 50 and 200 SMAs, at 15,255. Resistances lie at 15,555 and 15,782.


