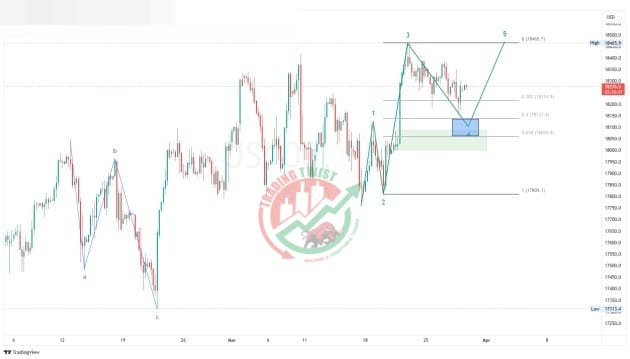
Nasdaq (US100) Chart Technical Outlook corrects lower toward 18,130 ahead of holidays
Nasdaq’s broad bias is bullish. Prices have been printing higher highs and higher lows for five months. Intraday charts show room for a downside correction toward the support zone of 50% and 61.8% Fibo levels – 18,060 and 18,130. Resistances are located at 18,350 and 18,460.
I expect flat-to-low price action ahead of the three-day weekend toward the mentioned support zone.


