
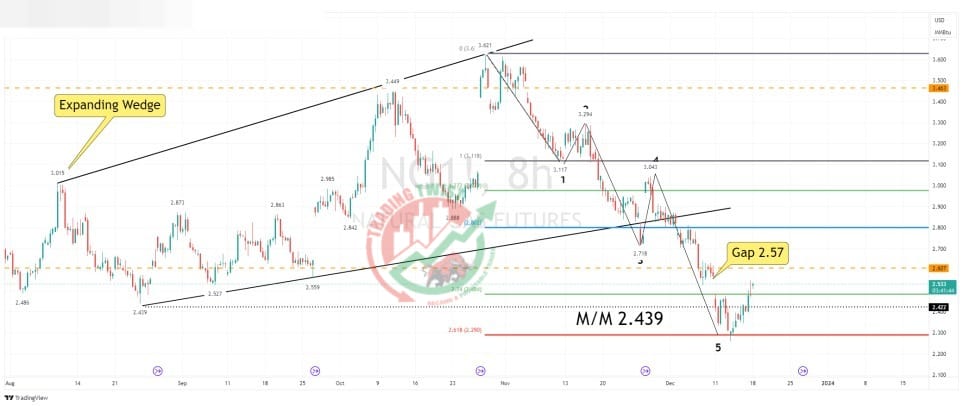
Natural Gas Chart Technical Outlook recovers from 261.8% extension
I believe we are now in the corrective wave higher. We completed the wedge target of 2.439. We have seen a bullish reversal close to the 261.8% extension level of 2.290. Although the immediate bias is mildly bullish, with a gap close at 2.57 and bespoke resistance at 2.607, further gains could be limited. I would look to the previous swing low of 2.439 as intraday support.


