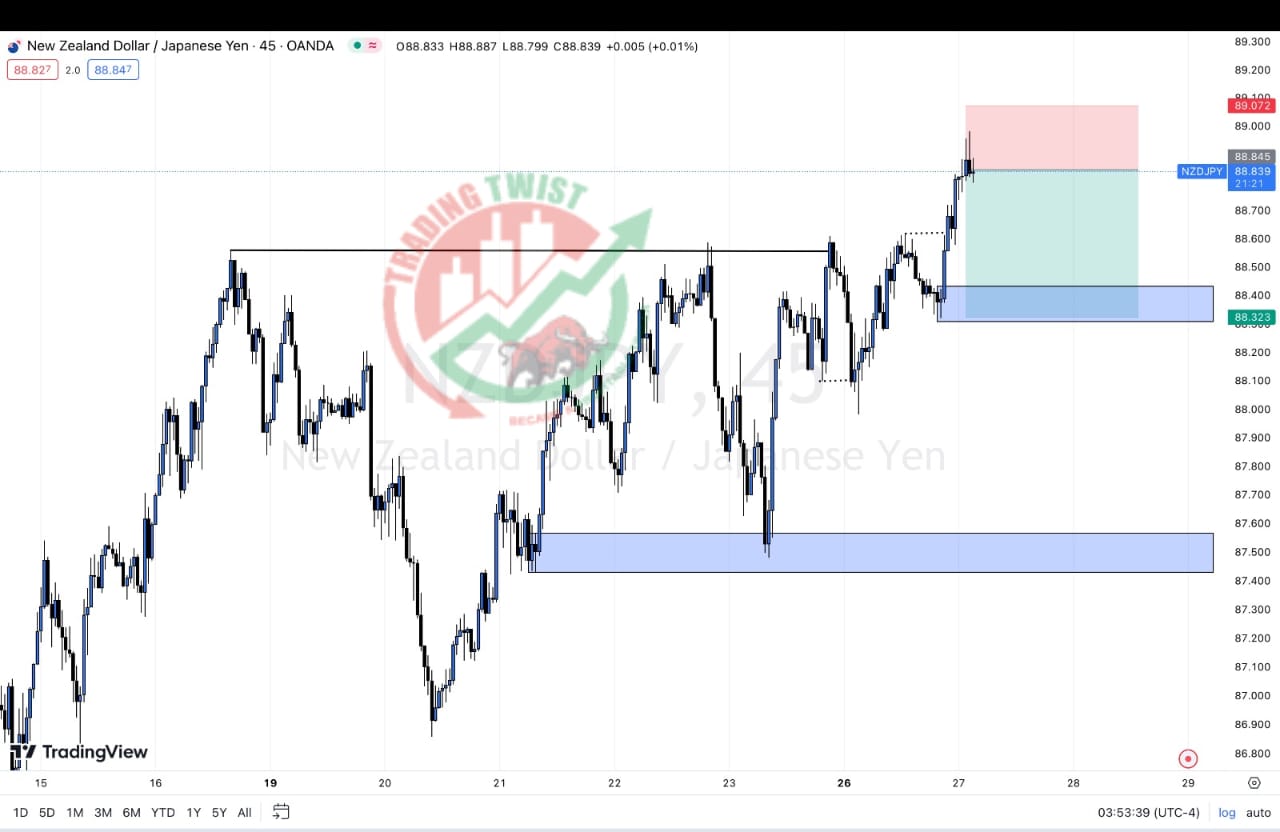
The technical analysis of the NZD/JPY chart, involves examining price action and various technical indicators. Here is an overview of the current state of the NZD/JPY chart:
Trend Analysis: The NZD/JPY pair has experienced mixed price action in recent months, making it important to closely monitor the chart for potential trend shifts. Presently, there is no clear dominant trend, and the price has been moving within a range, forming higher highs and higher lows, indicating a potential uptrend.
Key Levels: Identifying key levels on the NZD/JPY chart is crucial for assessing potential support and resistance areas. Currently, a significant resistance level can be observed around 80.00, which has posed a barrier to further upward movement. On the downside, the 77.00 level has acted as a reliable support level during recent pullbacks.


