
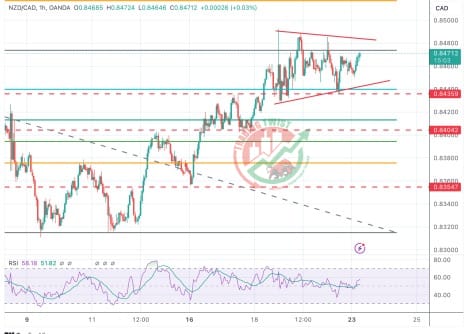
NZDCAD Chart Technical Outlook hesitates below 0.8490, forming a triangle pattern
The New Zealand Dollar is struggling to confirm above the resistance area at 0.8475-90 with the one-hour chart forming a triangle pattern, revealing hesitation on the market.
This is a continuation figure and has an eventual bullish bias although the higher Oil prices are supporting the commodity-linked CAD and acting as a weigh.
To the upside, resistances are 0.8490 and 0.8520. Supports are 0.8435 and 0.8405.


