
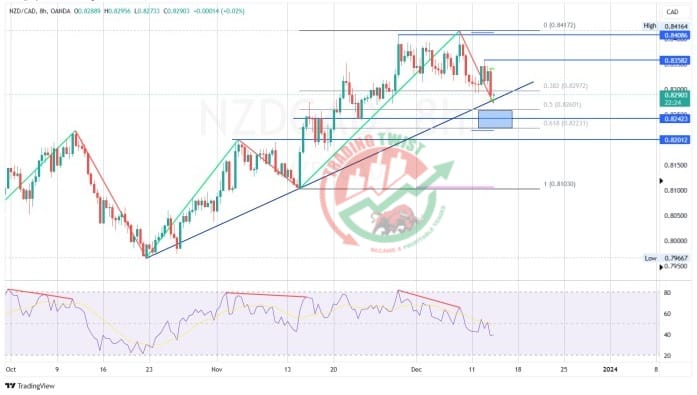
NZDCAD Chart Technical Outlook stalled at a confluence support of the daily ATR, a previous weekly POC, and a rising trendline. There is room for more losses toward 0.8240, a previously broken barrier, and within the support zone of 50% and 61.8% Fibo levels. The broad bias is bullish, and spikes down or dips should find buyers.
Resistances are at 0.8340 and 0.8390.


