
NZDUSD Chart Technical Outlook Buy the Dip, Sell the Rally
NZD/USD – the daily chart highlights the completion of a bearish Butterfly at 0.6143. Bespoke resistance is located at 0.6137 and 0.6139.
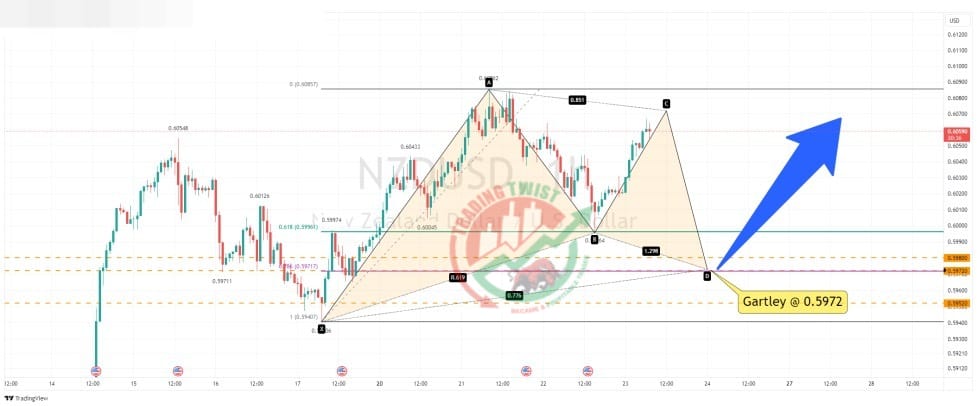
The intraday chart highlights buyers returning close to the 61.8% pullback level of 0.5996. A move to 0.5972 will form a bullish Gartley pattern. Bespoke support is located at 0.5980 and 0.5972.
Conclusion: after the US session we have the New Zealand Retail Sales data. We are expecting a fall of -0.8% quarter on quarter (QoQ). The single currency basket suggests selling rallies in the New Zealand Dollar. With the preferred stance for the US Dollar being buying dips, correlation studies would suggest selling the completion of the bearish Butterfly close to 0.6143. Short-term players could buy the cross at the completion of the Gartley formation at 0.5972.
Support: 0.5996 (61.8%), 0.5972 (Gartley and bespoke), 0.5941 (swing low)
Resistance: 0.6086 (swing high), 0.6137-39 (bespoke), 0.6143 (Gartley)


