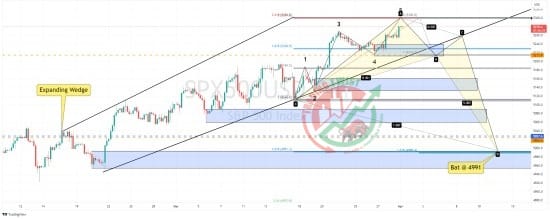
S&P 500 (US500) Chart Technical Outlook will complete a bullish Elliott Wave count at 5,300
Continued upward pressure from 5,214 has resulted in the index trading to a new all-time high.
The four-hour chart highlights a 261.8% extension level located at 5,300. This is a common target/reversal level for an Elliott Wave count (5 waves).
Price action has formed an expanding wedge pattern that has a bias to break to the downside.
Bespoke support is located at 5,214.
Using the smart money concept (SMC), we can see a Bat formation completing close to 4,991.
Conclusion: although there is no immediate indication of an immediate change of trend, I look to 5,300 as a potential top. The first downside target would be the bespoke support level of 5,214. The medium-term focus would be on the completion of the Bat pattern at the demand zone from Feb 20 (4,991)
Resistance: 5284 (all-time high), 5300 (261.8%), 5350 (Big Fig)
Support: 5214 (bespoke), 5025 (bespoke), 4991 (Bat)


