
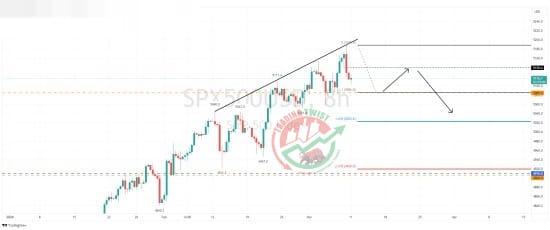
SP500 Chart Technical Outlook support levels line up with Fibonacci extensions
Bespoke support is located at 5,085 and 4,910. Using 5,189 as a swing high, we have a projected Elliott Wave count (5 waves) close to the barriers. The previous swing low is located at 4,922. In conclusion, a bounce from 5,086 would offer an opportunity to sell the index. The previous support 5139, becomes resistance. The index is on the watchlist as a trading plan


