
US CRUDE OIL Chart Technical Outlook builds a bullish expanding wedge pattern
The daily chart highlights US crude oil moving lower within the BC leg of a large Crab formation.
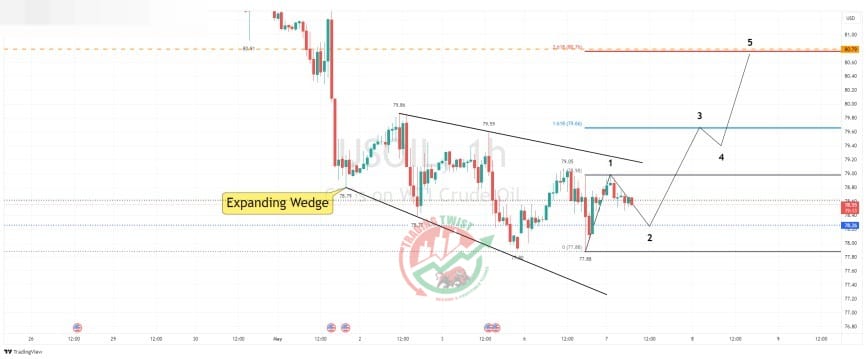
The one-hour chart highlights mixed and volatile trading. This has resulted in a bullish expanding wedge formation being posted. Support is located at $78.26. We have a 261.8% extension level located at $80.76. Bespoke resistance is located at $80.79.
The weekly chart highlights the previous swing low from the week of April 22 at $80.74. What was support, now becomes resistance. Last week’s strong selling pressure has resulted in a Marabuzo resistance level being located at $80.68 (a Marabuzo is the midpoint of a strongly bearish/bullish candle).
Resistance: $78.98 (overnight high), have $80.68 (Marabuzo), $80.79 (bespoke)
Support: $78.26 (bespoke), $77.88 (swing low), $76.76 (projected confluence)


