
US Crude Oil Chart Technical Outlook offers an inside pattern
The weekly chart highlights oil moving lower within the BC leg of a Crab formation.
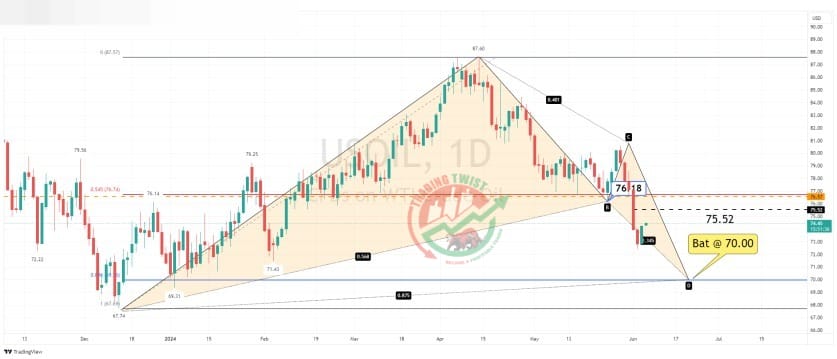
The daily chart highlights an inside pattern. This is a bullish Bat formation that will be completed at $70.00. Monday’s strong selling pressure has resulted in a Marabuzo resistance level at $75.52 (this is the midpoint of a strongly negative candle). The previous swing low of $76.18, was support, now becomes resistance. Bespoke resistance is located at $76.57.
The intraday chart highlights a 261.8% extension level at $75.33
Resistance: $75.33 (261.8%), $75.52 (Marabuzo), $76.57 (bespoke)
Support: $73.53 (previous resistance, now support), $72.43 (swing low), $70.00 (Bat)


