
US OIL Chart Technical Outlook building a bearish Head and Shoulders
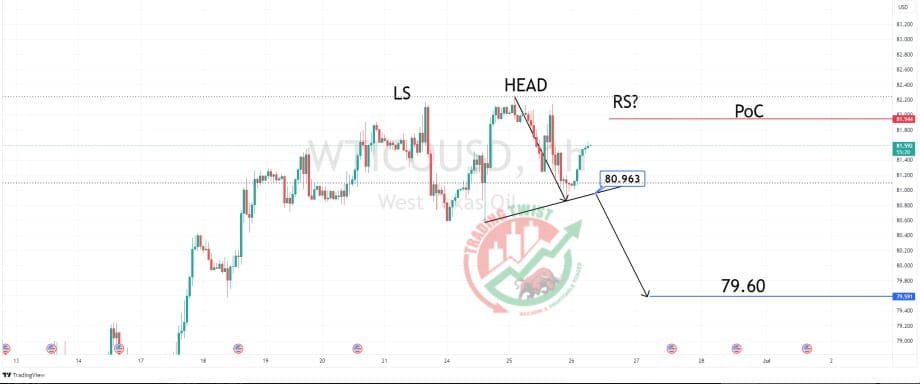
We have seen mixed daily trading results as oil consolidates close to the 61.8% pullback level of $82.17. The intraday chart highlights this week’s point of control (PoC) located at $81.95. We look to be forming a bearish head and shoulders pattern. On a break of the neckline at $80.96 the measured move target is $79.60.
Conclusion: although there is ample scope for further upside pressure, I would look for intraday rallies to find selling interest.


